| |
Exam Score Evaluator

 Our exams are tough - really tough and students are often disappointed
with the raw percentage score achieved on these exams. But what
really counts is how your score compares with the scores of other
students preparing for the NCE or SEE. For this reason, a few years
ago, we added a Pass Probability feature to our line of Practice
Exams. We are very happy to now be able to offer, to our Topic Exam
& SEE Prep Package customers, a means of comparing the results
of the Topic Exams and SEE Prep tests with the results of other
students from across the country.
 We deliver thousands of
Practice and Topic Exams every year. After completion, each of these
exams is reviewed and statistical information is gathered, which
allows us to accurately make comparisons and predictions of future
testing results. By using the exam evaluators below, you can now
assess your performance on our exams as compared to a national
average. We deliver thousands of
Practice and Topic Exams every year. After completion, each of these
exams is reviewed and statistical information is gathered, which
allows us to accurately make comparisons and predictions of future
testing results. By using the exam evaluators below, you can now
assess your performance on our exams as compared to a national
average.
 The
calculated comparison score reflects your overall performance on the
Topic Exams and SEE Prep exams as compared to other students,
effectively providing a national class ranking.
For example, an evaluation score of 42% implies that your
score is better than 57% of past exam takers, but is lower than
41% of past exam takers. The
calculated comparison score reflects your overall performance on the
Topic Exams and SEE Prep exams as compared to other students,
effectively providing a national class ranking.
For example, an evaluation score of 42% implies that your
score is better than 57% of past exam takers, but is lower than
41% of past exam takers.
 Many
anesthesia programs are now requiring an SEE score in the top-half of all
same-year students taking the exam. Using our Topic Exam & SEE Prep
evaluators, scores between 1 - 49% would reflect a performance in the
top half (greater than or equal to the 50th percentile) of exam takers.
This evaluation is very helpful in assessing your preparedness for the
SEE and/or NCE. Many
anesthesia programs are now requiring an SEE score in the top-half of all
same-year students taking the exam. Using our Topic Exam & SEE Prep
evaluators, scores between 1 - 49% would reflect a performance in the
top half (greater than or equal to the 50th percentile) of exam takers.
This evaluation is very helpful in assessing your preparedness for the
SEE and/or NCE.
 Select the Score Evaluator below to compare your score
with the national average.
Please use the Pass Probability feature to evaluate Practice Exam
performance
Technical Stuff:
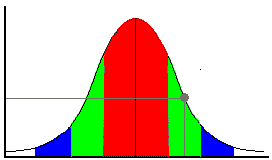
 The
score comparison is generated by evaluating the distance between your raw
score and the population mean in units of the standard deviation. This is
known as the "z-score". The comparison probability (evaluation of your score
as compared to others) is then calculated using: The
score comparison is generated by evaluating the distance between your raw
score and the population mean in units of the standard deviation. This is
known as the "z-score". The comparison probability (evaluation of your score
as compared to others) is then calculated using:

|
|
